The upcoming release of ZENworks Reporting 6.2.1 packs a punch in terms of new dashboard capabilities. Let me quickly walk you through five key improvements you can expect with this new release:
- Creating ad hoc view dashlets in the Dashboard Designer. In earlier versions of ZENworks Reporting if you wanted to create a dashboard you first needed to create the required reports and views. Only then was it possible to create a dashboard using those reports. If there was a slight change required, you had to go back and modify the reports and start again. Frankly, I know quite a few people just gave up at that point. With ZENworks Reporting 6.2.1, you can create an ad-hoc view or chart on the fly in the Dashboard Designer. You can choose from all available domain objects and filters and create a dashlet out it, without ever leaving the Dashboard Designer. In my opinion, this is really a game changer ensuring that dashboard creation need not be a planned activity.
- Enabling drill down in the dashboard. With this feature, you can click on a piece of information in a dashlet and see the other dashlets update with corresponding details. While designing a dashboard, you can identify a drillable field in a dashlet and link it with corresponding filters in other dashlets. When the field is clicked, corresponding values are passed as parameters to other dashlets which then get updated. You can also click a dashboard chart and have it open up a third party web site, passing parameters from the report to it.
- Generating cross domain reports. It is no longer necessary that all reports or views within a dashboard belong to the same domain because you can now create a dashboard spanning multiple domains. The new Filter manager allows you to configure how data is passed between reports and even map filters across reports. For example, you can report on data in ZENworks but pass a filter to show Service Desk data related to an object as well. This can be really useful when you want to create a dashboard across multiple Endpoint Management products.
- Faster dashboard performance. There has been a marked improvement in the rendering of dashboards. Gone is the noticeable lag in displaying of data.
- New chart types. ZENworks Reporting 6.2.1 also offers some compelling new chart types, including heat map type charts that make representing large amounts of data and navigating that data much simpler.
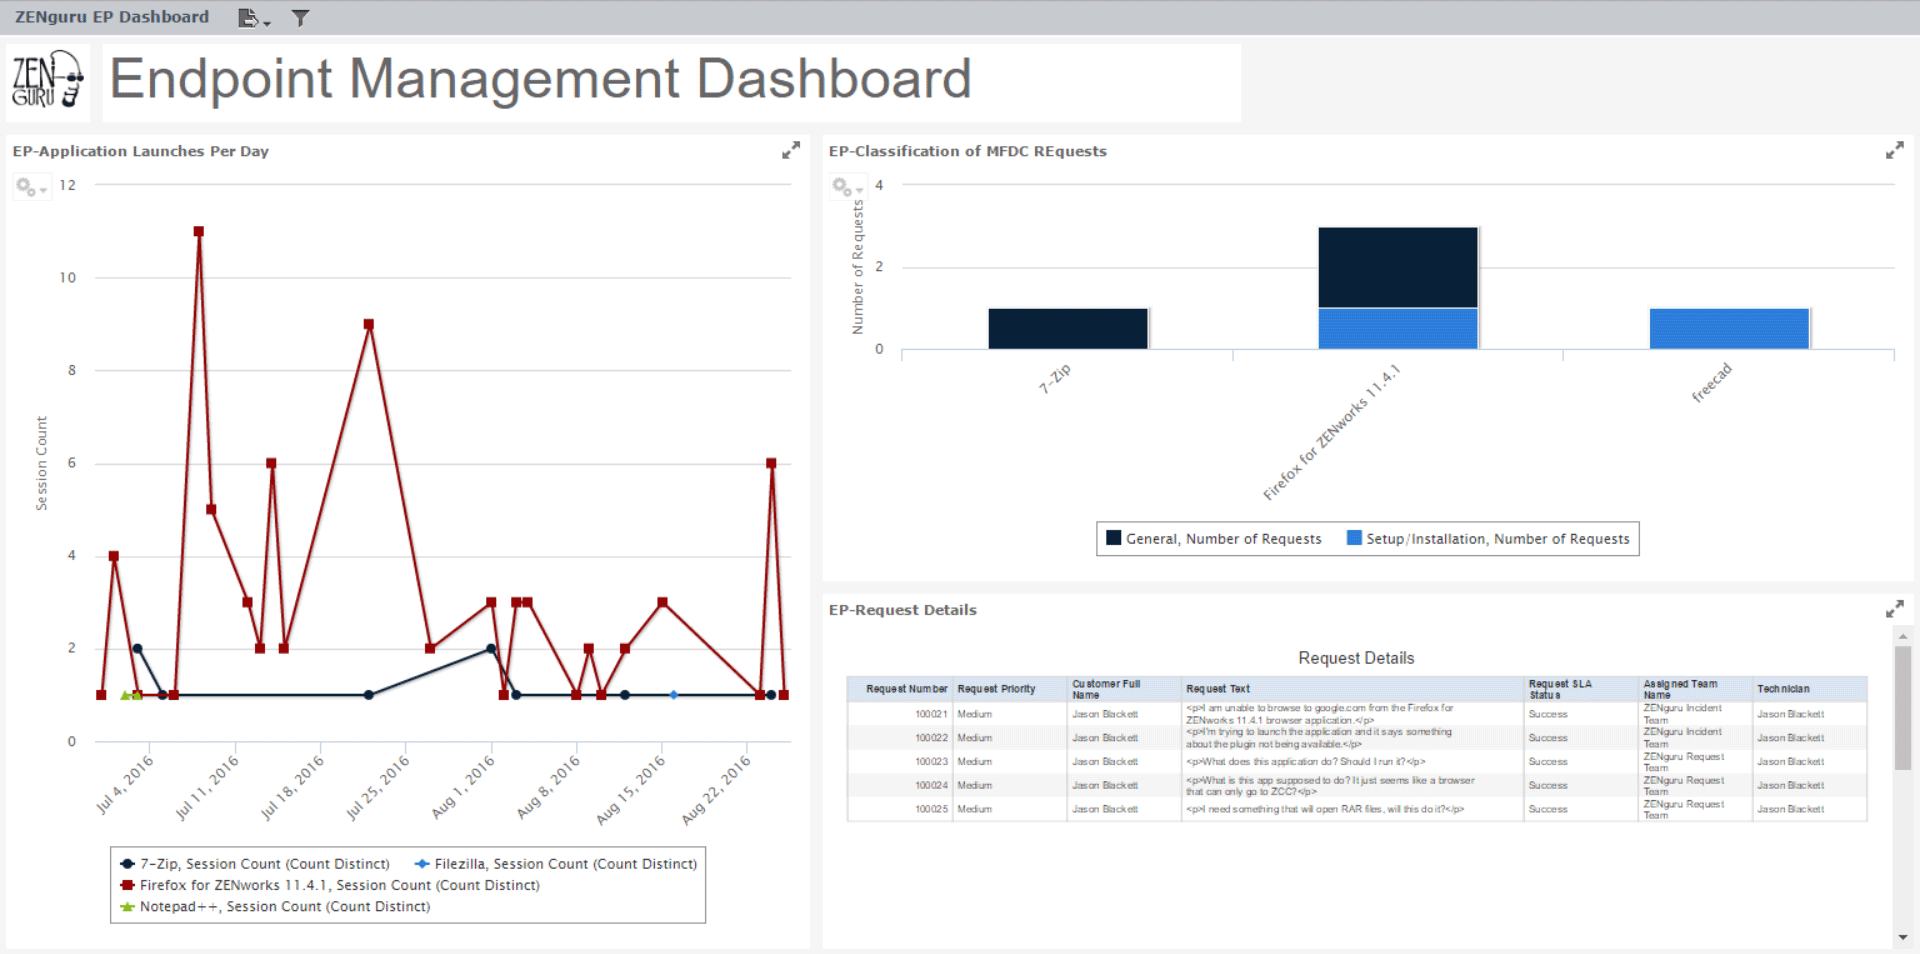
Displayed above is a sample dashboard created using ZENworks Reporting 6.2.1. With the significant improvements made in this release, it is now even easier to present complex information in an impressive and interactive manner.
This article was first published in OHM35, 2016/4, p16