The NetIQ Identity Manager is a very powerful Identity Management tool. It offers a lot of functionality for user provisioning, role based access control, segregation of duties, approval and recertification processes. But when it comes to audit what ever happens in your IDM system, the event and audit system (EAS) that is included in the IDM advanced edition is not able to show an accurate real time overview of all the events that have been processed. In addition the EAS system is not as easy to install and to configure as you might expect.
These are the reasons why we decided to develop our own IDM audit dashboard. The goal was to develop a powerful, flexible, simple to install and easy to use audit tool for building informative and meaningful dashboards and reports for audit and compliance purposes.
Our IDM Audit, Security and compliance dashboards deliver detailed information about all attribute values of any object in your directory at any time (present and history) and about each event (adds, modifies, renames, moves and remove) that has taken place (see figure 1).
The components
The IDM audit dashboard consists of a number of components. Some are proprietary and some are open source tools. Following is a list of the main components of the solution:
- eDirectory as the IDM Data Vault
- Audit Driver to synchronise the data
- Logstash as data store
- Elasticsearch as search and analytics engine
- Kibana as the visualisation dashboard
- IDM Audit, security and report dashboards
All components are available for MS-Windows and Linux. You can install all components on the same server or on different servers. So you can install the Audit driver on one of your IDM Engine servers, elasticsearch on a second server and kibana on the third server. In case you want to make the Audit dashboard reachable from the internet you can keep the data in your internal and secure LAN and only place the kibana part on a web server in the DMZ.
- eDirectory. Of course the base of everything is the use of eDirectory as the Identity Vault and the IDM engine. Thanks to the real time event system of eDirectory and the IDM engine we can trigger every event that takes place within eDirectory, whether it is a creation, modification, move, rename or removal of a object or attribute.
- Audit Driver. SKyPRO have developed a very flexible driver listening to all the events on objects and attributes we want to audit in our audit database. Whenever you want to add more object classes or attributes to audit, just add them to the driver filter. No further attribute mapping is required. You do not even have to make changes to the elasticsearch database.
- Logstash helps you take logs and other time based event data from any system and store it in a single place for additional transformation and processing. Logstash parse all data sources into an easy to read JSON format. It is the most popular open source logging solution in the market today.
- Elasticsearch (http://www.elasticsearch.org) is used as our flexible and powerful, distributed real time search and analytics engine. It is architected from the ground up for use in distributed environments where reliability and scalability are must haves. Elasticsearch gives you the ability to move easily beyond simple full-text search. Through its robust set of APIs and query DSLs, plus clients for the most popular programming languages, Elasticsearch delivers on the near limitless promises of search technology. Elasticsearch delivers realtime data regardless of your incoming data stream. It scales horizontally out of the box. As you need more capacity, just add more nodes, and let the cluster reorganise itself to take advantage of the extra hardware. Elasticsearch clusters are resilient they will detect and remove failed nodes, and reorganise themselves to ensure that your data is safe and accessible.
- Kibana works seamlessly with elasticsearch to visualise your data (http://www.elasticsearch.org) and offers a lot of different graphical building blocks. For the visualisation no coding is required. Kibana delivers real time analyses of streaming data into the elasticsearch. Create ticker-like comparisons of queries across a time range. Compare across days or a rolling view of average change. To better understand large volumes of data, easily create bar, line and scatter plots, or pie charts and maps.
IDM Audit & Security Dashboard
We have preconfigured two dashboards with the Kibana visualisation components. The IDM Audit Dashboard visualises in histograms, pie and bar charts all events of the different object classes that have taken place within a specific period of time. It shows trends and important security information such as the number of failed logins or disabled users.
The security dashboard visualises important security information such as the number of intruder locks, login intruder attempts, number of users that have been disabled or enabled within a specific time period.
Thirdly, the report dashboard shows historic information about all object values for compliance purposes. You can schedule how often the current state of objects have to be saved to our audit system and the period we have to keep the data.
Installation
To install the IDM Audit Dashboard go to our web site http://www.skypro.ch and download the complete installation file audit.rar. This file contains all the required packages. After download unpack it and you should have the following files:
| audit-driver.xml |
IDM driver for the lucene DB |
| auditdriver.jar | appshim component for the IDM driver |
| IDM Audit Dasboard.json | IDM Audit Dashboard example |
| IDM Security Dashboard.json | IDM Security Dashboard example |
| IDM Compliance Dashboard.json | IDM Compliance Dashboard example |
| common-io-1.4.jar | appshim components for the IDM driver |
| elasticsearch-1.0.0.tar.gz | lucene with elasticsearch |
| json-simple-1.1.1.jar | appshim components for the IDM driver |
| kibana-3.0.0ms5.tar.gz | kibana visualisation components |
| template.json | json template for the driver appshi |
Install elasticsearch and logstash
The first step is to install elasticsearch and logstash. Unpack the elasticsearch-1.0.0.tar.gz file. Tha package contains both components. The content of the file will be unpacked in the directory elasticsearch-1.0.0.
Copy the whole unpacked directory to your standard program directory. On SUSE linux we suggest to copy it to /opt/elasticsearch-1.0.0. To start the elasticsearch engine type:
on linux: bin/elasticsearch
on windows: bin/elasticsearch.bat
If no java is installed download and install the latest java. If there is no java path configured in your Linux environment define the JAVA_HOME path e.g. export JAVA_HOME=/jre. If elasticsearch wont start make sure you have installed the latest jre, version 7.
Install Kibana
The second step is the installation of the kibana component. Unpack the kibana-latest.zip. Copy the unpacked directory to your web server folder. On SUSE linux we suggest /srv/www/htdocs/kibana. Open the config.js file in the kibana directory and set the elasticsearch parameter to the fully qualified hostname of your elasticsearch server. For example
elasticsearch: http://elasticsearch.mycompany.com:9200
To check whether kibana is running open your web browser and enter the URL
http://elasticsearch.mycompany.com/kibana
The default kibana welcome page should then open.
Build the Audit Driver
Before we start to create the audit driver with designer we have to copy the necessary files for the driver appshim. Copy the following files to the dirxml class directory.
auditdriver.jar
common-io-1.4.jar
json-simple-1.1.1.jar
template.json
On SUSE linux the default path is /opt/novell/eDirectory/lib/dirxml/classes. Look for your dirxml class directory eDirectory/lib/dirxml/classes on your server.
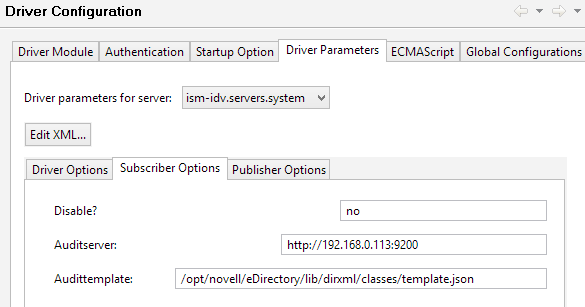
To build the driver then open designer. Create a new driver by importing the driver file audit-driver.xml. Right click the driver and open the driver properties. Go to the Driver Configuration and open the Driver Parameters Tab. Click the Subscriber Options tab and enter the parameters of your elasticsearch server and the folder and filename where you have placed the json template.
Deploy the driver to your IDM server. If you want to monitor more or less objects or attributes just open the driver filter and change the filter accordingly.
To test the driver start the driver and change the description attribute of a user. The modify event should be successfully synchronised to the elasticsearch database.
Install the sample dashboards
Now youre almost ready to go. For your convenience we provide two dashboards files. The IDM Audit Dashboard example file, IDM Audit Dashboard.json, and the Security Dashboard example file IDM Security Dashboard.json. Open the kibana home page, click the folder icon in the upper right corner, go to advanced and click the Browse button under local files and select the provided dashboard example files to load our IDM Audit and Security Dashboard examples. Click the save button, also located in the upper right corner, to save the dashboard in your kibana environment. Now you can select this dashboard anytime with the folder button.
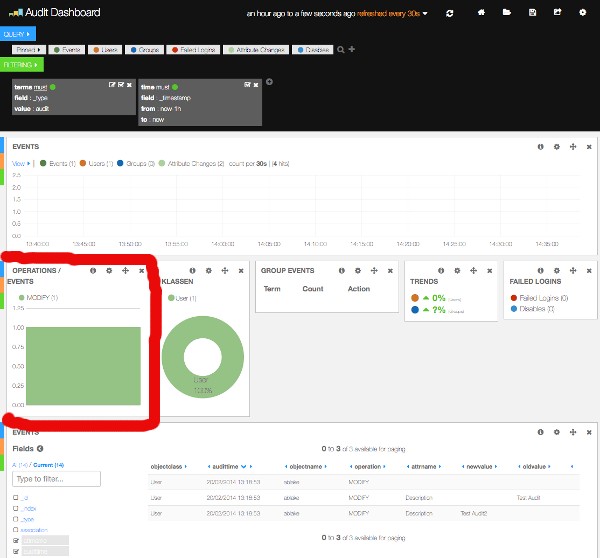
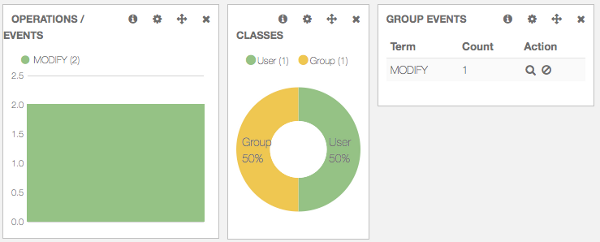
If you have executed the change of a user description attribute you should see this modify event already in your dashboard (see figure 3). In the Operation / Events graphic you will see one modify event. In the Classes graphic you see that one user object so far was audited. In the Events table at the bottom you see the basic data. You see three entries of object class user with objectname ablake. The first entry is the modification event. The second entry shows the old value Test Audit of the modified attribute description and the third entry shows the new value TestAudit2.
Experience the IDM Audit Dashboard
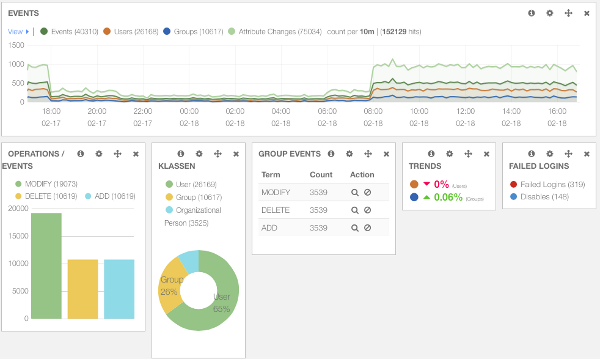
Now change the description of a group object and look at the dashboard again. You will see two modification events under OPERATIONS and two classes Users and Group. Also in the GROUP EVENTS you see now one modification.
Also in the event histogram you will see these two modifications in the timeline. You see the user event in orange, the group event in blue and the attribute changes in light green. Also have a look at the table at the bottom. You see three new entries for the group modification.
Understanding the IDM Audit Dashboard
There are some base elements you have to know about to understand the kibana dashboard.
Query: With queries you select all the elements you want to display in your dashboard. You can pin queries so you can use them in panels directly to select specific data. In all panels you can decide to use data from all pinned or unpinned queries or select data from specific pinned queries.
We have predefined some pinned queries to select events, users, groups, failed logins, attribute changes and users that have been disabled.
Filter: With filters you filter the data you have selected with your query. For example you only want to have user objects or objects with a specific objectname. Mostly you will use the filter to narrow the time frame of events you want to see, such as only changes that have taken place the last 24 hours.
Our standard filter selects only events of type audit. For reporting purposes we have additional types like report that gathers all data relating to an object at a specific time.
Row: A row can hold one or multiple panels. You can add new rows at the bottom. You can move rows at any time to the position you want to have them.
Panel: Panels are the actual graphical building blocks of kibana. Panels can show maps, tables, histograms, hits, pie charts, statistics, trends or just explanatory text.
Working with Panels
Change an existing Panel
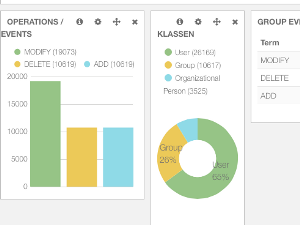
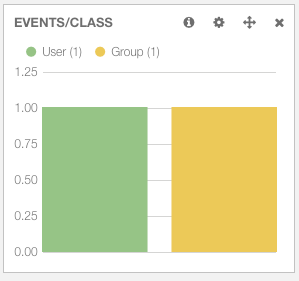
We have a panel called GROUP EVENTS. Wouldn't it be nice to show both user and group events? Click the configure icon in the GROUP EVENTS panel. In the General tab and change the title to Events / Class. In the Panel tab change the Field Parameter from operation to objectclass. Now it's not operations like Modify, Add etc. that are counted but different object classes. In the view Options change the style from table to bar. Activate the Queries tab and deactivate Users and active Events. Save the panel settings. The graphic has changed to a bar chart (figure 5) showing the events that occurred per class in the given time frame.
Add a new Panel
Imagine we want to have a pie chart showing us all the modify events per class. First we add a new query for all modify events. In the QUERY row click the + sign at the right. Enter the following query string operation:MODIFY AND event:true. This selects all events that are not the actual attribute changes but only the modify event. Click the coloured dot on the left, as Legend value enter Modify and pin the query.
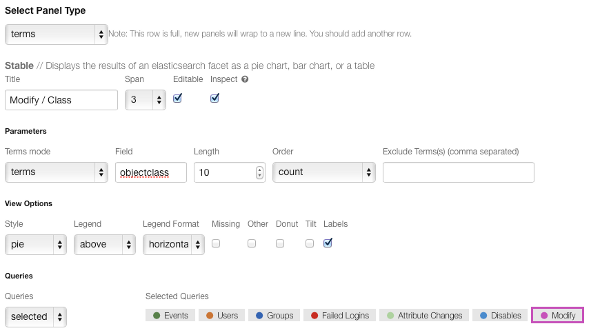
You should see a new pinned query. Now go to the row with the OPERATIONS / EVENTS panel on the left and click the green + symbol to add a panel. At panel type select terms. For title type Modify / Class. In the Parameters field type objectclass as the Field value. Uncheck Missing and Other in the View Options and select pie as the graphic view. In the Queries dropdown chose Selected and activate the pinned Modify query. Save the panel.
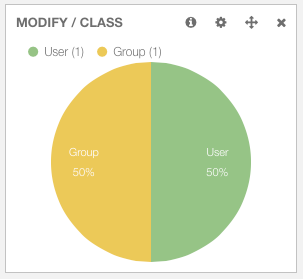
Bravo, you have successfully added a new panel showing a pie with the numbers of modifies per object class as shown in figure 7.
Now you can play around with new rows, add new panels and gain experience with all the various graphical building blocks.
Create a new row
New were going to create a new row with new panels. The goal is to create a separate histogram and pie chart for user and group events. First go to the bottom of the dashboard and click ADD A ROW. In the title field enter User & Group Statistics and press Create Row. Move the new row above the Events row in the dashboard settings.
Now you have an empty row where we can add new panels. Press Add panel to empty row. Select histogram as panel type. Enter User Changes in the field Title and change the Time Field from @timestamp to _timestamp. Change the span value to 6. Change the Queries to selected and enable Users.
Add a second histogram panel for groups and name it Group Changes, change the Time Field, correct the span value and change the Queries to enable Groups only.
Congratulations - you have successfully added a new row with two histogram panels. Now create, modify and delete some users and groups in your directory and you will see the events reported in these histograms.
Conclusion
With our IDM Audit driver and the open source components elasticsearch and kibana you were able to create powerful IDM Audit dashboards in next to no time. All components fulfil every requirement you could expect from a professional SIEM (Secure Identity and Event Management) solution.
Elasticsearch is able to process thousands of events per second; can be clustered and guarantees automatic fail-over and high availability. Kibana is a very powerful and easy to use visualisation component offering a range of graphical building blocks.
In the upcoming version of our IDM Audit Dashboard we will even log the current states of objects on a scheduled base. So you will know the values of all attributes at any time for compliance purposes.
(This article was first published in Open Horizons Magazine Issue 25, p23-27, April 2014)