It’s encouraging to see that more customers are discovering the power of ZENworks Reporting, not only in combination with ZENworks Configuration Management but also in combination with Micro Focus Service Desk (MFSD). For some time we have had a Service Desk domain available, but unfortunately with Reporting 5.6 some additional rights where needed so that we from Micro Focus needed to assist during the installation. Now that we have Reporting 6.2 released I hope that we’ll soon have the updated Service Desk domain available on Cool Solutions so that it will be easier to install the Service Desk domain.
In recent months I have assisted some of our Service Desk customers with the installation of the Service Desk domain and in this issue I’ll cover two questions that came up at these customers. Obviously these questions also apply to creating reports against ZCM.
Q: How can I create a graph showing the number of service desk tickets created per month?
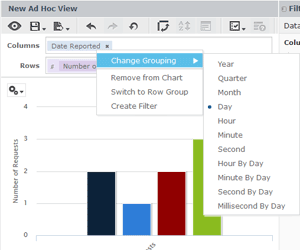
A: This can be done using the Ad Hoc View. In this case you need to select the MFSD Domain and select Requests to report against and specify you want to create a Chart. For Columns select “Date Reported” and for Rows select the Measure “Number of Requests”.
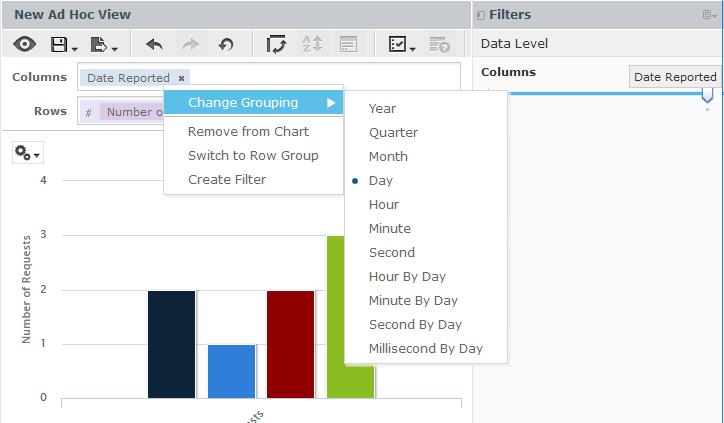
The Graph that is created (Figure 1) will show the incidents per day. To get a report for Incidents per month, right click on “Date Reported”. Now the Grouping for this item can be changed to Month so you will get the number of requests per month in your chart.
Q: I have watched a short video on Youtube where Jason Blackett explains how to create dynamic dashboards (HowTo Create Dashboards using ZENworks Reporting 6.2.1). How can I create a dashboard that will show a graph with the incidents per month and the incident details in a table on the right side. When I click a specific month, I want the table to show the incidents for that month.
A: Here a different approach is needed as the grouping that we used in the previous question can’t be used to hyperlink different panels on a dashboard.
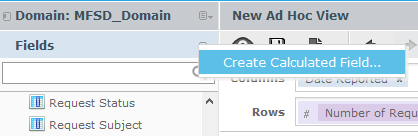
The Hyperlink feature on the dashboard needs a specific field, so we need to create a Field that represents the month that the incident was created and use that to create the chart and use this as a filter for the report with incident details. Next to Fields click the little menu icon to “Create Calculated Field…”. as shown in figure 2.
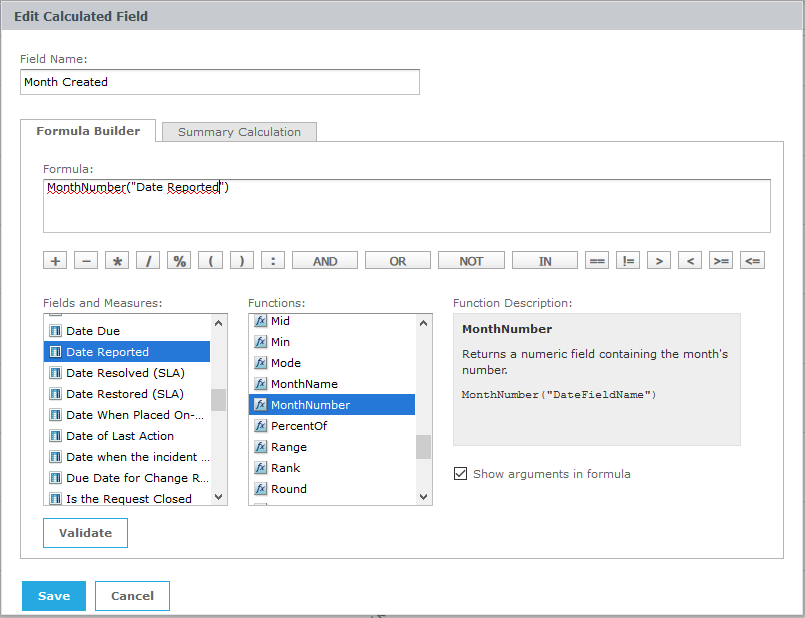
Now specify a name for the Calculated Field, in this case let’s use “Month Reported”. For Functions scroll down and double-click “MonthNumber” (using numbers such as these will sort properly when creating a Graph), this will add the function in the Formula field.
Next we need to replace DateFieldName with the Field name we would like to use, in this case “Date Reported”. Now save this Calculated Field and use Month Created to create the Chart.
If needed you can create a calculated Field for Year as well and use this within your reports (figure 3).
In the report that shows the incident details create the same Calculated Field and use this as a filter that can be used in the Dashboard Hyperlink.
Q: What’s new in Service Desk 7.3?
A: Service Desk 7.3 was released in November 2016. As my colleague Gil Cattelain writes “its most impressive feature is the all-new Micro Focus Service Desk Store. This is a self-service portal that enables users and customers to submit service requests directly to IT. “
This portal also makes it easy for managers and administrators to approve, manage, and track service requests from a single hub.
Within the store, users can submit a variety of requests. For example, users can request everyday systems and applications as well as managed devices (like desktops, laptops, phones and other items) and non-managed devices (like cars, SIM cards). Users can also request files, videos and training materials.
Different portals are available for administrators, users and customers.
Keep in mind that Service Desk isn’t the only enhancement to Service Desk 7.3. You will also find the following upgrades:
- Postgres 9.6 support
- Oracle 12c support
- MySQL support
- Upgraded SLES12 appliance and SLES12 SP1 installer/Windows installer
- Upgraded security with root password enablement
- GW2014 support
This article was first published in OH Magazine Issue 36, 2017/1, p37-38