One of the requests that I’ve heard several times over the years is to be able to create big screen dashboards for the teams that support ZENworks. This could be for any of the ZENworks products, including ZENworks Configuration Management and Micro Focus Service Desk. In this article I will help you understand how ZENworks Reporting and JasperStudio can be used together to create big screen dashboards that will help you quickly identify trends in the environment.
Before we get into the details, a quick word about the things you need:
- ZENworks Reporting Appliance. ZENworks Reporting is available only as a virtual appliance and is one of the downloads you can download from the same product download page you downloaded your other ZENworks products from. The ZENworks Reporting Appliance provides the web based reporting creation and dashboarding tools that we will use to deliver the dashboard.
- JasperStudio. JasperStudio is a tool for advanced users that can be used to create pixel-perfect reports. In this article we’ll use JaspertStudio to create some small dashboard widgets that would otherwise not be possible from the web based Ad hoc viewer.
- Reporting Domain. A reporting domain is a metadata layer that eliminates the need for you to understand the database schema when building reports with the ad hoc report builder. Depending on the data you want to access you will need different domains installed. For the purpose of this article we will be using the ZENworks Domain.
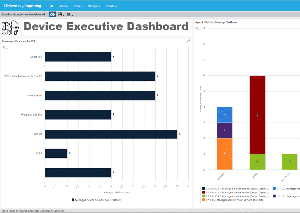
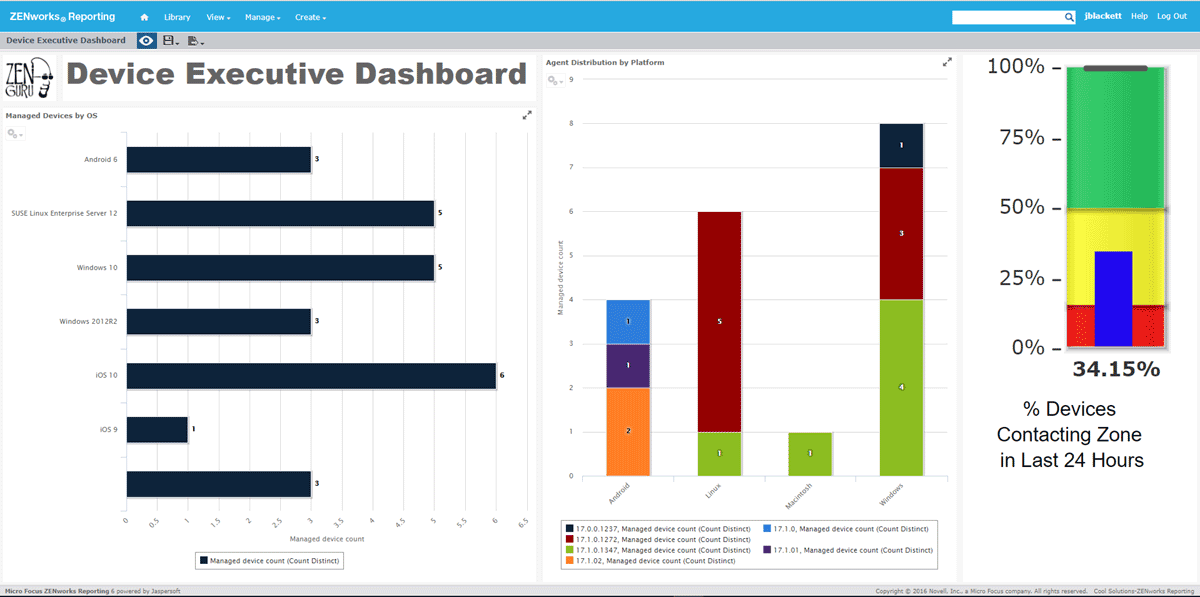
First of all let’s take a look at the finished product so that you know what it is we are building towards. Have a look at figure 1. This is just one of many possible dashboards that you can build with the techniques discussed in this article.
This dashboard offers a quick view of information about the devices being managed in the system and whether they are checking in as expected.
Building Adhoc Dashlets
We’ll start by looking at how to build the dashlets created with the Adhoc report designer. These are by far the easiest dashlets to build. In the example dashboard these are the Managed Devices by OS and Agent Distribution by Platform dashlets. You can use the Ad Hoc designer to build chart, table and crosstab dashlets.
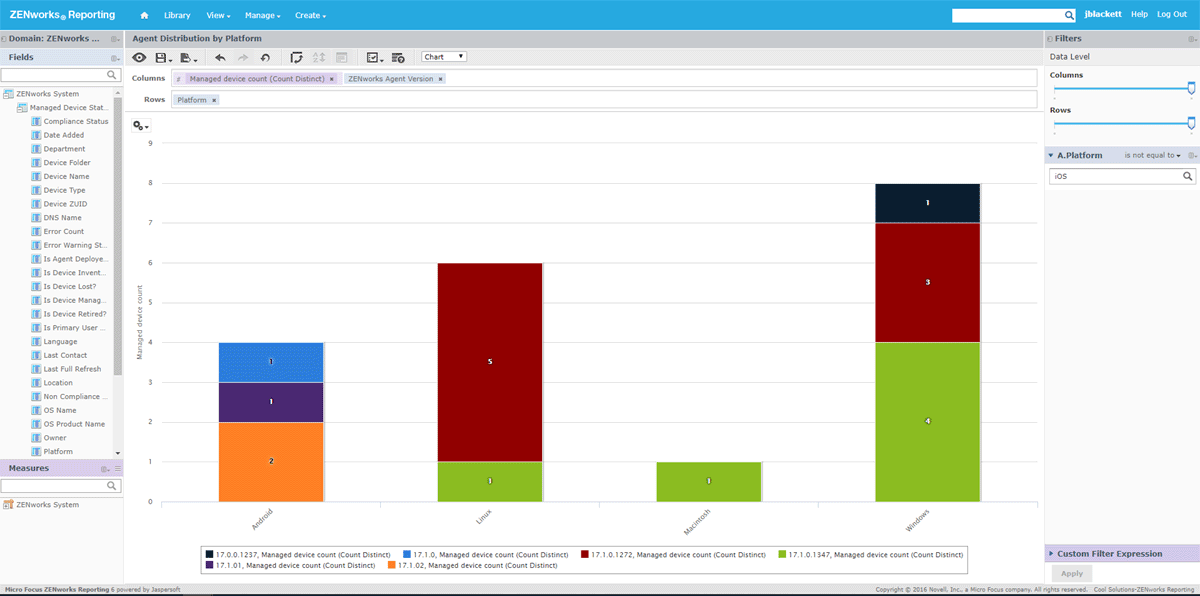
Agent Distribution by Platform Dashlet
The first dashlet for our dashboard will display a breakdown of the agent and application versions being used on the devices in the zone. These will be broken down by platform and then by agent version.
- Browse to your ZRS Server console (https://<server>/jasperserver-pro)
- Login as a user that has permissions to create reports.
- Select Create > Ad Hoc View.
- From the list of domains, select the ZENworks Domain; then click OK.
- You now need to select the data that you want to have available for this dashlet :
ZENworks System > Managed Device Status > Managed device count
ZENworks System > Managed Device Status > ZENworks Agent Version
ZENworks System > Managed Device Status > Platform - Click OK.
- Next select the Chart type report and then drag the elements that you see in the screen shot below to the Columns, Rows and Filters area. This should result in a pie chart.
- Next click the gears icon and choose Chart Types… and then select the Stacked Column chart type. Close the chooser and then slide the Data Level sliders all the way to the right. You should now have a chart that looks very similar to figure 2. Since this is a chart that will go on a dashboard, you can also hide the title since it will already be listed in the dashboard by clicking
 and toggling the title bar.
 - Now save this Adhoc View with the title that you want to appear on the Dashboard.
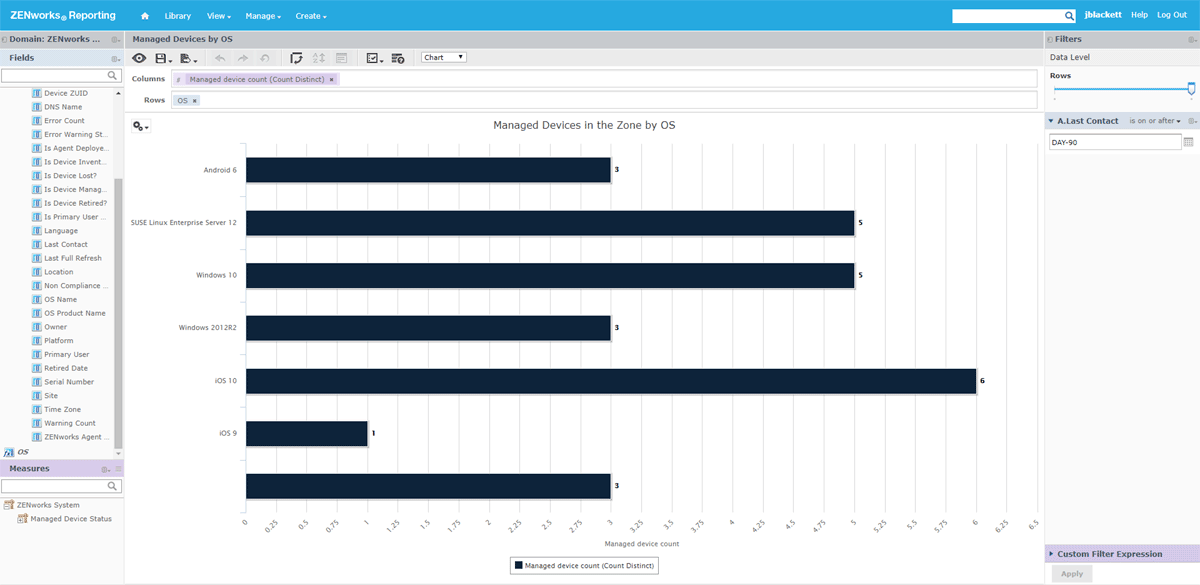
Managed Devices by OS Dashlet
The next dashlet shows you the distribution of OS’s being managed in the environment broken down by major version.
- Select Create > Ad Hoc View.
- From the list of domains, select the ZENworks Domain; then click OK.
- You now need to select the data that you want to have available for these dashlets. The data required for building the Agent Distribution by Platform Dashlet is
ZENworks System > Managed Device Status > OS Name
ZENworks System > Managed Device Status > Managed device count - Click OK.
- Because the data stored in the database does not include a value for OS and Version in a friendly way we’ll use a Calculated Field to get the data in the form we want. To do this, in the fields header, click the dropdown and select Create calculated field.
- For Field Name, enter OS.
- In the Formula builder enter something like this
“IF(StartsWith(“OS Name”, ‘Android-6’), ‘Android 6’, IF(StartsWith(“OS Name”, ‘iOS-10’), ‘iOS 10’, IF(StartsWith(“OS Name”, ‘iOS-9’), ‘iOS 9’, IF(StartsWith(“OS Name”, ‘windows10’), ‘Windows 10’, IF(StartsWith(“OS Name”, ‘win2012r2’), ‘Windows 2012R2’, IF(StartsWith(“OS Name”, ‘sles-12’), ‘SUSE Linux Enterprise Server 12’))))))” - Save the Custom Field.
- Next select the Chart type report and then drag the elements that you see in the screen shot below to the Columns, Rows and Filters area. This should result in a pie chart.
- Next click the gears icon and choose Chart Types… and then select the Stacked Column chart type. Close the chooser and then slide the Data Level sliders all the way to the right. You should now have a chart that looks very similar to figure 3.
- Since this is a chart that will go on a dashboard, you can also hide the title since it will already be listed in the dashboard by clicking and toggling the title bar.
- Now save this Adhoc View with the title that you want to appear on the Dashboard.
You have now built the second adhoc widget you need for your dashboard.
Building Dashlets with JasperStudio
The next dashlets that we need to build for our dashboard cannot be built with the Ad Hoc designer because they are not domain elements and because the types of elements we want to create are not available in Ad Hoc designer. Unlike Ad Hoc designer which uses the domain to generate data, JasperStudio can use either the domain or handcrafted SQL. In these examples we use handcrafted SQL.
% Devices Contacting Zone in Last 24 Hours
The first dashlet we want to create is a graphic indicator that shows the percentage of devices that are contacting the zone within at least the last 24 hours. We want to display it in such a way as to know when things are good, when they are concerning and when they are critical. These values could be different in your environment and you could adjust them appropriately.
Let’s take a look at how to build out this dashlet.
- Install and launch JasperStudio.
- Create a data adapter for the ZENworks Database.
In the top right pane, right click Data Adapters and select Create data adapter.
From the Data Adapters list, select Database JDBC Connection.
In the Name field, enter ZENworks Database.
In the JDBC Driver field, select the driver that corresponds to the type of database you are using.
Update the JDBC Url field to reference you server and database names, similar to this:
jdbc:tibcosoftware:sqlserver://mssql.activedir.zenguru.info:1433;databaseName=zenworks_ZENGURU
Enter your database username and password, then click Test. Assuming that the connection test is successful, click Finish and a new data adapter should be added. This allows JasperStudio to communicate with the ZENworks database. - Create the report
Select File > New > JasperReport
From the Report Templates dialog, select All > Blank Letter, the click Next.
Enter the name of the report you want to create, then click Next.
From the Data Adapter drop-down, select the ZENworks Database adapter.
In the Texts field enter the following SQL statement: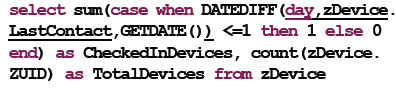 You should now have a dialog that looks like the one in figure 4.
Click Next.
On the Group By Page, click Next.
Click Finish.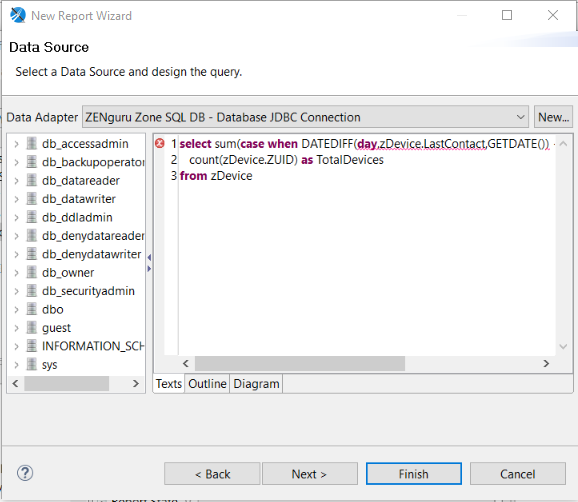
Figure 4: Data source and SQL statement - Customise the report.
In the Outline pane, expand Fields and highlight CheckedInDevices.
In the Properties pane change the Class value to java.lang. Double to cast the field as a double value instead of an Integer. Repeat this for the TotalDevices field.
Click on the Table and press the Delete key; then say Yes when prompted to remove everything.
In the Outline pane, right click Title and select Delete. Repeat for Page Header, Column Header, Column Footer, Page Footer, Summary and Background.
Right click Detail and click Add Band.
Right click and select Page Format.
Set the Page format as shown in figure 5:
Click OK.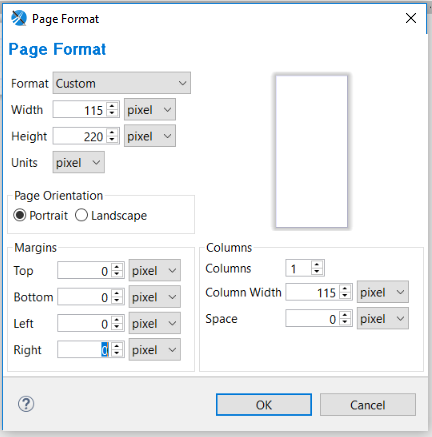
Figure 5: Setting the page format - Add and configure the Vertical Bullet widget to the Details pane.
From the Palette, drag the Widgets Pro item to the Details pane.
Select Vertical Bullet.
Resize the image to fit the page with a room for a label underneath.
Drag a Static Text element from the Palette to the free space below the Vertical Bullet you added and change the Text to “% Devices w/ Last Contact within 24 hrs”
Right click the Vertical Bullet diagram and select Edit Widget Properties.
Select the Widget Data tab.
Select the Value and Target subtab.
Enter ($F{CheckedInDevices}/$F{TotalDevices})*100 as the Value expression.
Enter 100 as the Target expression.
Select the Color Ranges tab.
Click Add.
In the Color chooser, select green.
In the Label Expression, enter “Normal”, including the quotes.
In the Min Value Expression field, enter 50.
In the Max Value Expression field, enter 100.
Click OK.
Click Add.
In the Color chooser, select yellow.
In the Label Expression, enter “Warning”, including the quotes.
In the Min Value Expression field, enter 15.
In the Max Value Expression field, enter 49.99.
Click OK.
Click Add.
In the Colour chooser, select red.
In the Label Expression, enter “Critical”, including the quotes.
In the Min Value Expression field, enter 14.99.
In the Max Value Expression field, enter 0.
Click OK.
Click OK.
In the Report Design pane click the Preview Subtab. Make sure no errors are returned. You will see a blank report since the JasperStudio cannot render the graph. This can only be done from the web browser. - Import the report into the web server so that it can be used in the dashboard.
Save the report and make a note of the location you saved it to.
Open the ZRS web page in a browser and login as a ZRS User.
Right-click the Organization > Reports folder.
Select Add Resources > JasperReport
In the Name field enter Agent Contact Dashlet
Click the Browse button to Upload a Local File.
Select your report file you created.
Click the Data Source button on the left.
Select Select data source from repository and browse and select the ZENworks_Datasource.
Click Submit.
Click on the Report you added to confirm that it runs and displays the Vertical Bullet as expected.
You have now completed building your JasperStudio widget. You can use JasperStudio to build a number of additional widgets including simple clickable text fields to radiate numbers as well as other information radiators such as gauges, thermometers, etc.
Putting it all together into a dashboard
The final step is to put this all together in a dashboard. To do this you use the ZENworks Reporting Dashboard Designer and drag the reports that you have created onto the canvas. To do this:
- In ZENworks Reporting select Create Dashboard.
- From the New Content pane drag a Text element into the canvas.
- In the Text field, enter Device Executive Dashboard, then click OK.
- Resize the element to the top ½ inch or so of the screen.
- Right click the element and select the Scale to Fit option as Dashlet.
- Click OK.
- Now resize the dashlet to so there is no empty space at the end of it.
- Now drag in each of the reports you created and arrange them on the canvas in the way you want to see them.
- Click the Gear icon in the toolbar and enable Auto-refresh dashboard contents.
- Click the Preview button (eye) in the dashboard to see what your dashboard will look like.
- If everything works as expected then save the Dashboard.
- Finally, you need to determine the URL of the dashboard that you would want to display on the big screen. To do this find the Dashboard in the Repository and click on it to open it in View mode.
- Note the address in the bar, it should be something like : https://<server>/jasperserver-pro/dashboard/viewer.html #%2FArticleDash
- Modify the address to be https://<server>/jasperserver-pro/dashboard/viewer.html?decorate=no#%2FArticleDash. This removes the ZENworks Reporting menu bars so that only the dashboard is shown.
- If you visit this page and put the browser in Full Screen mode you are left with a dashboard that can be monitored on a big screen.
This article covered a relatively simple example of a dashboard that could be quickly built. ZENworks Reporting also provides the ability to provider interactivity and hyperlinking in the dashboard so that if you want a user to click in one dashlet and have other dashlets updated you can do that. Additionally, with JasperStudio you have complete flexibility in creating hyperlinks to other Jasper reports or even external content.
I encourage you if you haven’t yet installed ZENworks Reporting to do so today, and then let your imagination run wild. If you have questions feel free to reach out to us at zen@microfocus.com and we’ll be happy to provide some guidance.
This article was first published in OHM Issue 38 (2017/3), p19-22.
Thanks Jason, great article.
I would just like to find the correct embedded Sybase JDBC connection driver/Url.
Have both configured and passing “Test”, but when creating report I get “TDS Protocol error .Invalid packet type 0xc” with SourceForge driver and “JZ0SB: Parameter index out of range: 1” error on jdbc4 driver …. Can connect fine to reporting server under “Servers”.
I’m glad you enjoyed it. The easiest way to get the Sybase driver is from your ZRS server. We use the jconn4 driver and you can find the jar file on your ZENworks Reporting Server under /opt/novell/zenworks-reporting/bin/tool/config/Common/jar.
The correct connection string is jdbc:sybase:Tds::?ServiceName=
Let me know if you have any more problems.
Great, that driver is working fine. It would be great if you included it in Jaspersoft Studio out of the box also.